How does it work?
Generalities
Hortinergy is an online software providing an efficient way to optimize the climate and the energy performances of greenhouses. It allows you to know and optimize energy consumption and expenditures of your agricultural greenhouse projects.
Hortinergy gives you the opportunity to:
- Compare the different technical solutions available for your project
- Find the optimal configuration according to your needs
- Sustainably reduce your energy costs
In order to help you in your futur choices, we put at your disposal a form that you will have to fill-in with all the information relating to your greenhouse. Once the form is filled in, you receive a detailed report of the calculated results within 5 minutes according to the data you typed in.
Thereby you obtain:
- A full detailed PDF report,
- An Excel file with hourly-based data for a full representative year,
- An Excel file with daily-based average data for each month.
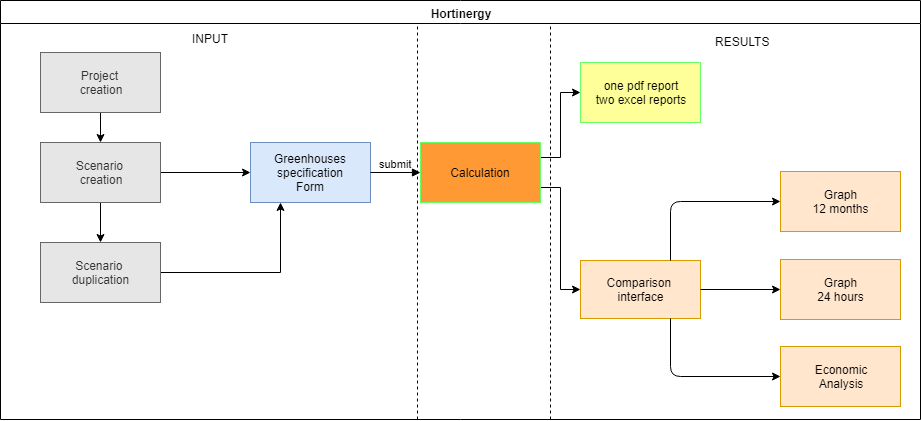
Once you have done several scenarios on a greenhouse project, you can compare these scenarios through our comparison interface. You may compare for example the energy costs between different optimisation or the return on investment.
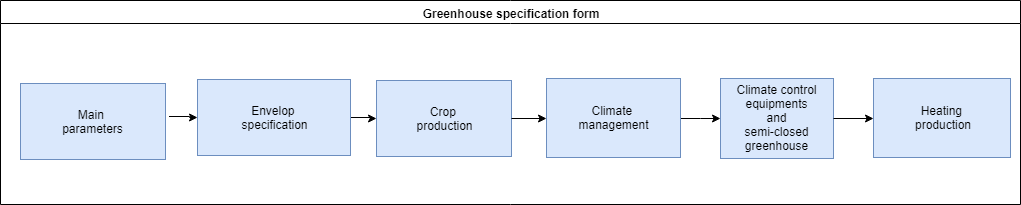
The form, easy to fill in, is divided into 7 parts represented by tabs:
The form
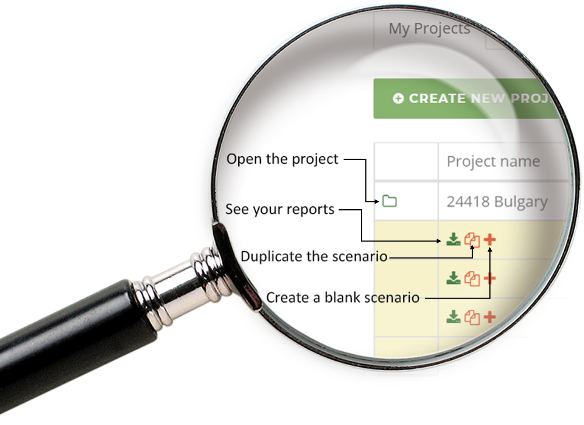
In the first tab, you will have to enter the geographical coordinates of your greenhouse: it will be your “project”. Each variation you make on this project will be a “scenario”. These scenarios can be duplicated identically so you just have to change the parameters you are looking for.
All the data are easy to enter in the form, and we give you indications of usual values for each data you have to fill in.
Remember that if you have any issue with the form, we will be glad to help you out.
Keep in touch with us either by e-mail or phone!
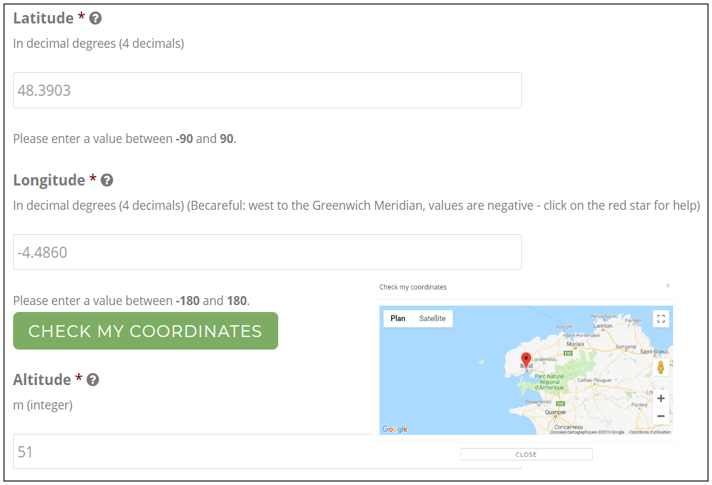
Location of your greenhouse
Enter the geographical coordinates of your greenhouse in order to locate it. You can check if these coordinates are correct simply by clicking on the button “check my coordinates”.
This will open a map with a mark on where your greenhouse is located. Regarding meteorological informations, we are getting back the precise data we need.
Characteristics of your greenhouse
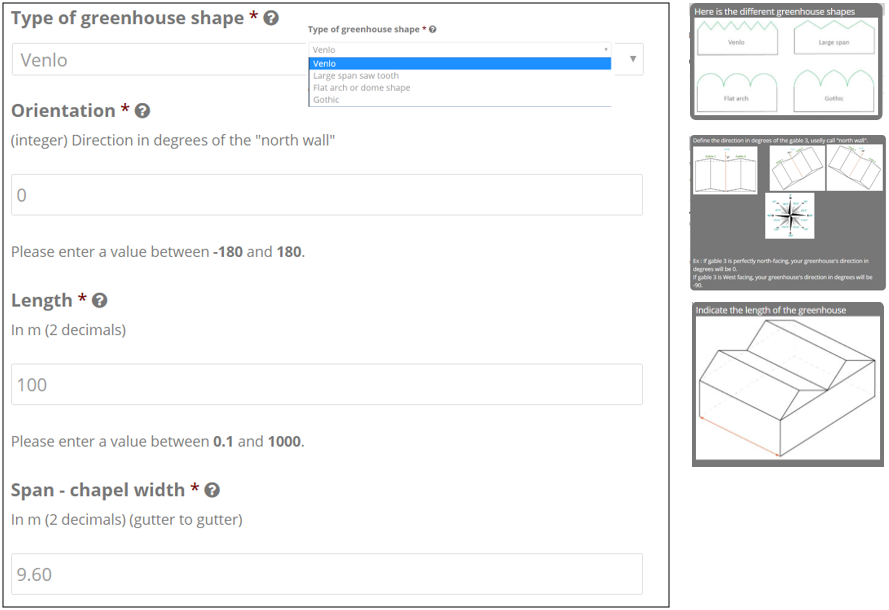
Choose your type of greenhouse through our drop-down list, and enter its orientation and dimensions.
Different parameters allow you to note the characteristics of your greenhouse, such as the number of chapels and their length.
Cover and screen specifications
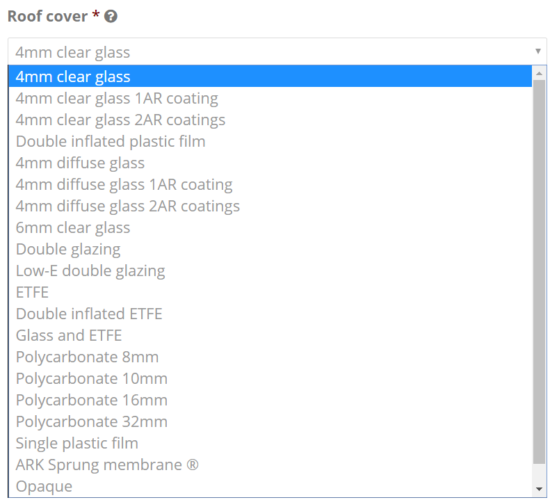
You can quickly choose your roof type with our large library. More than twenty roof cover are registered. It goes from single plastic layer to more complicated cover such as 4mm diffuse glass 2 AR coatings or ETFE technology.
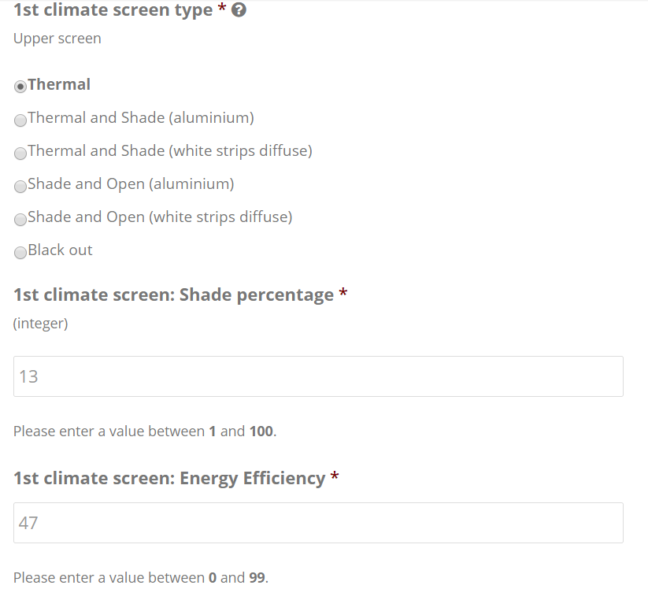
Further on, if you have one (or more), you can choose your screen type from our list, and set its characteristics. Up to three horizontal screens can be added to the settings of your greenhouse.
Your crop production
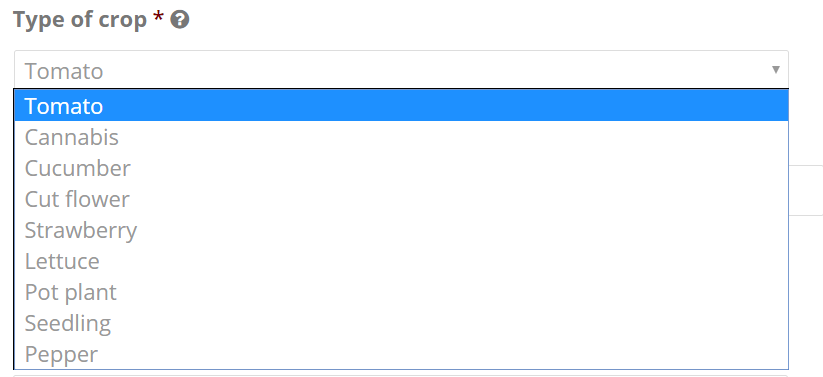
Quickly fill in your agricultural production from those listed. You can choose between: tomato, cannabis, cucumber, cut flower, strawberry, salad, pot plant, seedlings and pepper. Others will be added soon!
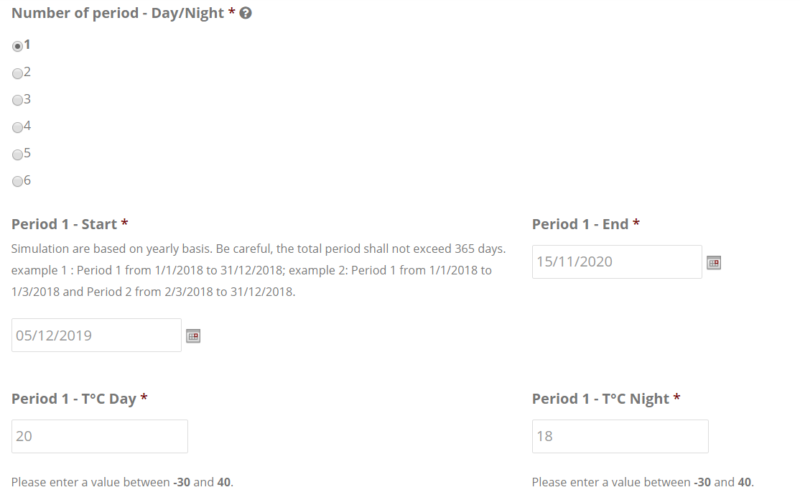
Set temperature
You can enter the same parameters as those of a climate computer, for example day and night set temperatures for different periods of the year.
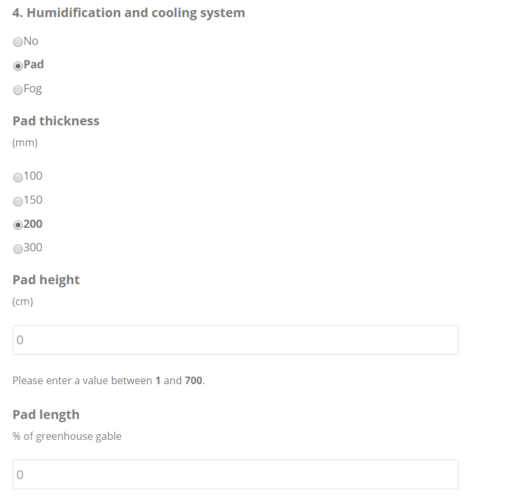
Semi-closed and cooling system
Hortinergy calculates controlled ventilation, dehumidification and cooling needs for semi-closed greenhouse.
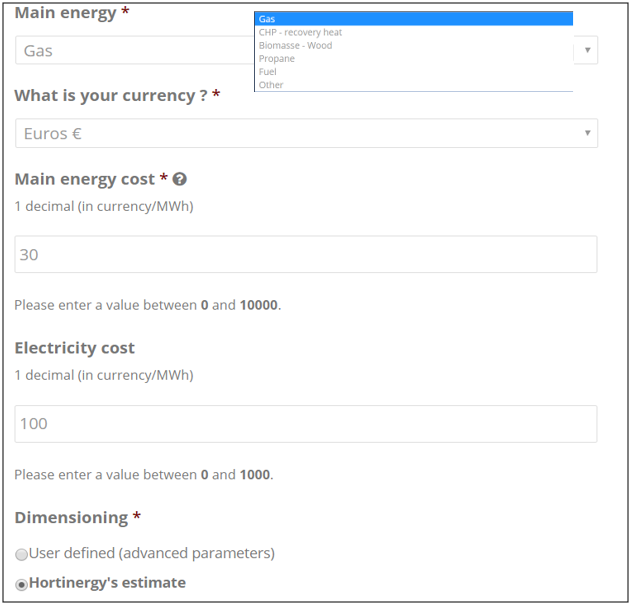
Heating management
To simulate the energy consumption cost of your greenhouse, you can enter the type of energy you are using to heat up your greenhouse, and the currency of your country.
Report
The report is sent to you about 5 minutes after you submitted your form. It is available in PDF format, easy to download.
You can see below examples of tables and charts in the report.
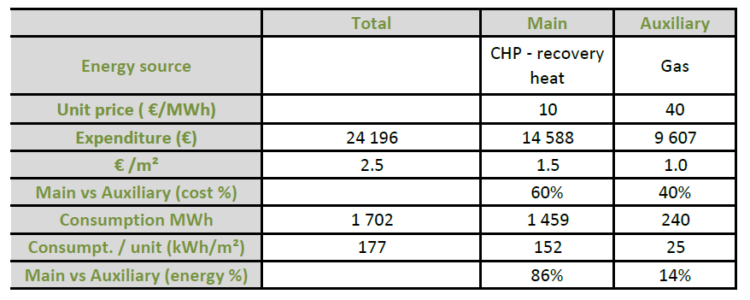
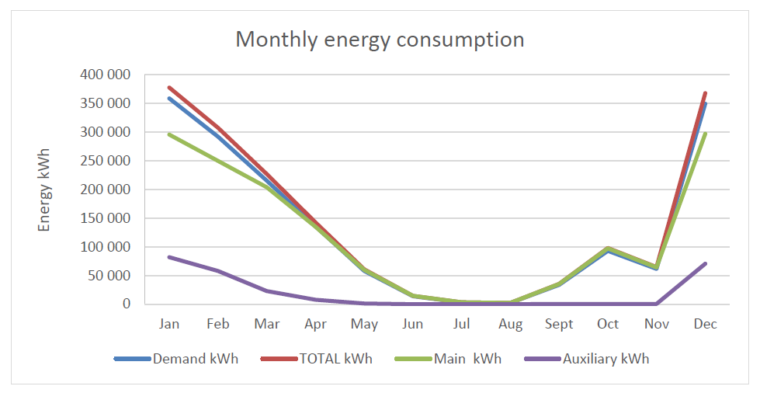
Energy consumption
In the report you will find the energy costs and consumption of your greenhouse, detailed in your currency, but also the heating consumption of your greenhouse month by month.
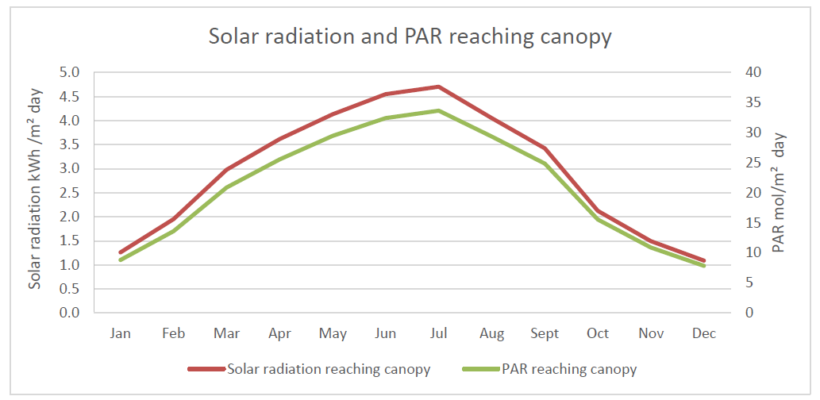
Light
Check the solar radiation graph on your greenhouse to see the evolution of solar radiation and photosynthetic radiation reaching the canopy.
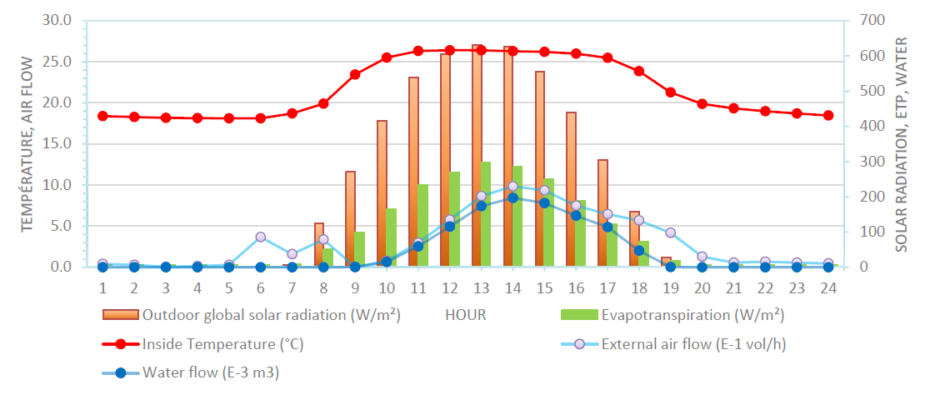
Indoor climate simulation
Detailed charts of the indoor climate on typical days for different months of the year give you the opportunity to compare solar radiation, indoor temperature or canopy evapotranspiration.
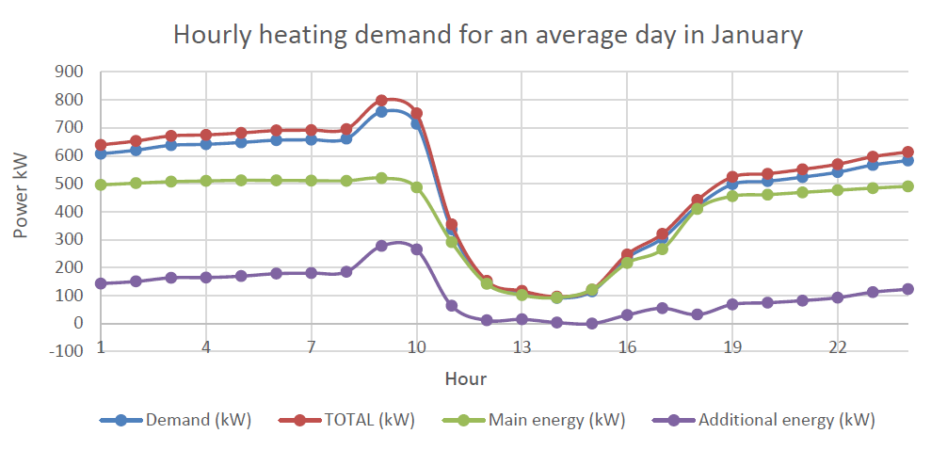
Hourly heating demand
We also offer the possibility to see in kW the heating demand of your greenhouse for an average day each month.
Comparison interface

Thanks to the comparison interface, you can compare different scenarios you have created from a greenhouse project.
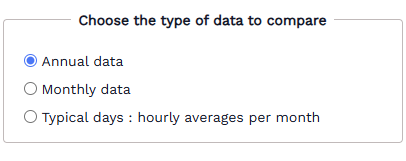
You can choose between 12 months or 24 hours charts with different comparison possibilities.
For instance, you will have these columns with the 12 months graph:
Energy:
- Heating demand (MWh) based on your greenhouse and crop specification
- Total heating consumption including the efficiency of your heating system (MWh)
- Main heating device consumption (MWh)
- Auxiliary heating device consumption (MWh)
- Electricity for light (MWh)
Costs:
- Total energy expenditure (depending on your currency)
- Total heating expenditure (depending on your currency)
- Main heating expenditure (depending on your currency)
- Auxiliary heating expenditure (depending on your currency)
- Fan expenditure (depending on your currency)
- Supplemental lighting expenditure (depending on your currency)
Solar radiation:
- Internal solar radiation (kWh/m² day)
- PAR internal (mol/m² day)
Auxiliary:
- Cooling needs (MWh)
- Water for pad / fog (m3)

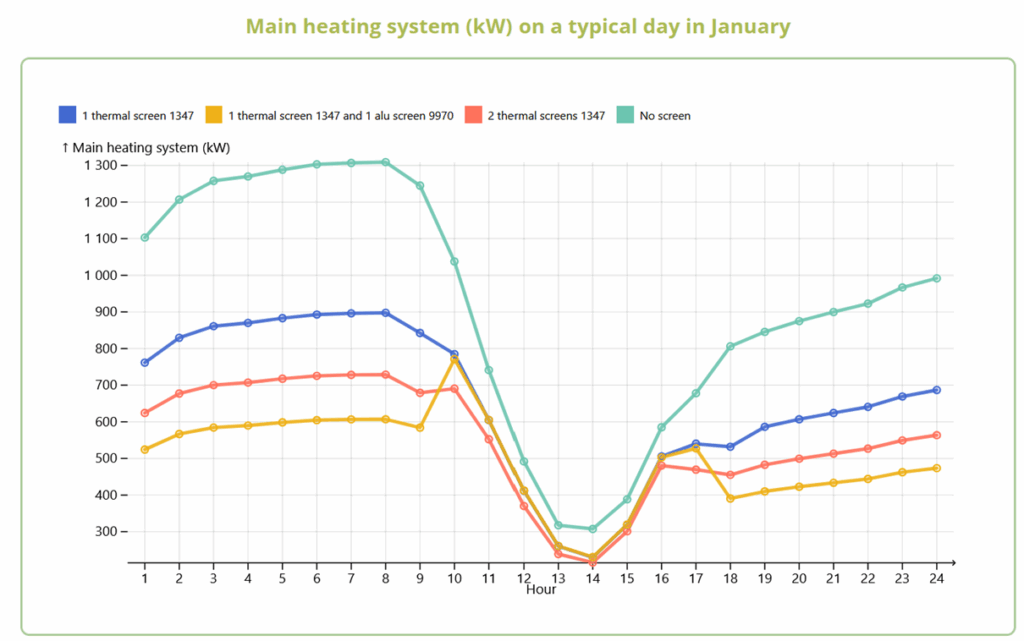
Data comparison
For instance, here is the graph of the heating power for an average day in January, according to the number and type of screens.
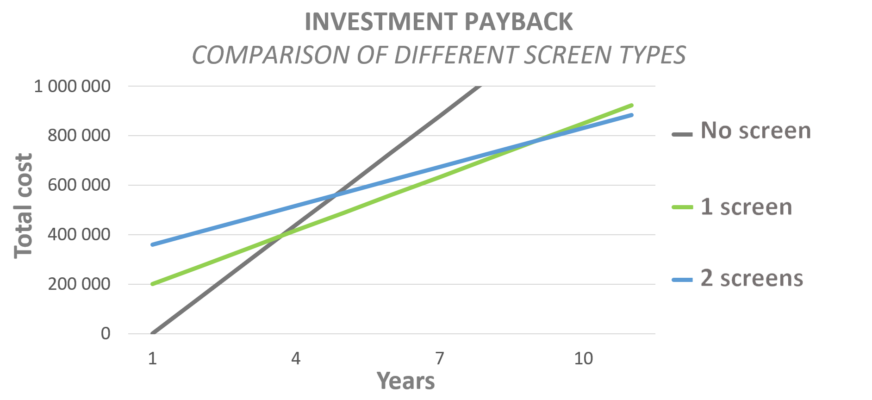
Economic analysis
You can also proceed to an economic analysis in relation to your greenhouse project.
This interface is very useful to compare different scenarios for the same project. For instance:
- with/without thermal screen
- 4/6 mm glasses
If you still have any questions, do not hesitate to contact us.