Simulate the climate control and risks analysis of your greenhouse project
Hortinergy is an online software to simulate climate control greenhouse project.
You can model inner climate and simulate energy consumption in horticultural greenhouses all over the world.
User can set climate control with:
- Temperature: day/night,
- Humidity: relative humidity / hydric deficit: min/max,
- Solar radiation: regulation of shading and blackout screen.
Hortinergy predicts the inner climate on an hourly basis: temperature, relative humidity, hydric deficit and solar radiation.
Based on these results, Hortinergy provides an analysis of the climate control:
- Daily correlation between internal solar radiation and average indoor temperature.
- Correlation between indoor temperature and hydric deficit.
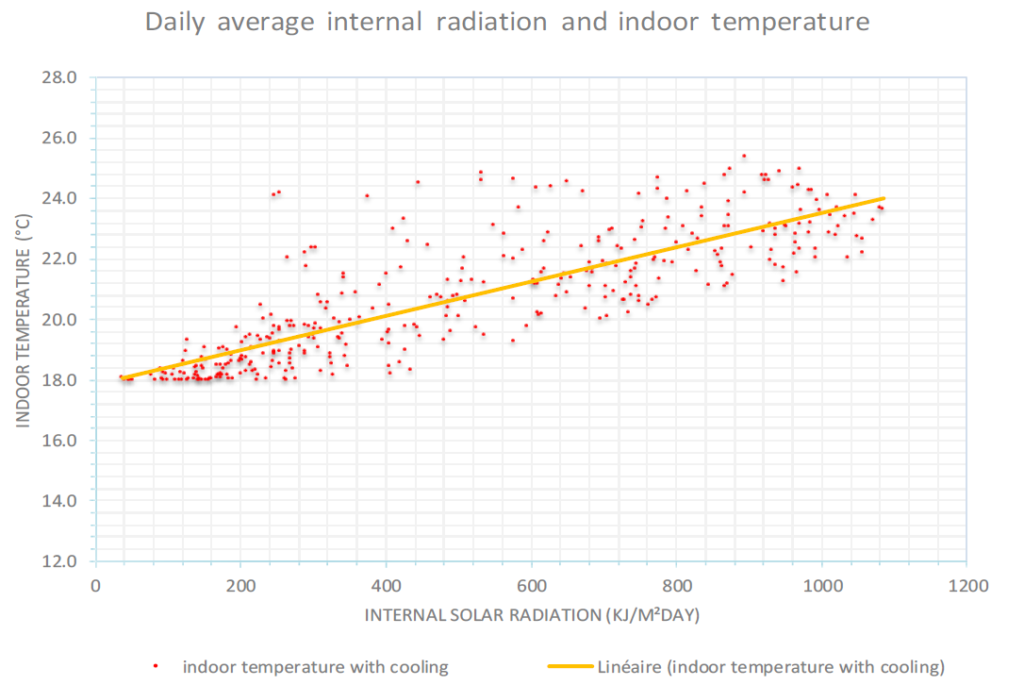
1. Daily correlation between internal solar radiation and average indoor temperature
The following chart shows daily correlation between internal solar radiation and average indoor temperature of the period’s production.
It helps to analyse climate control by assessing if average 24h temperature is not too low or too high according to solar radiation.
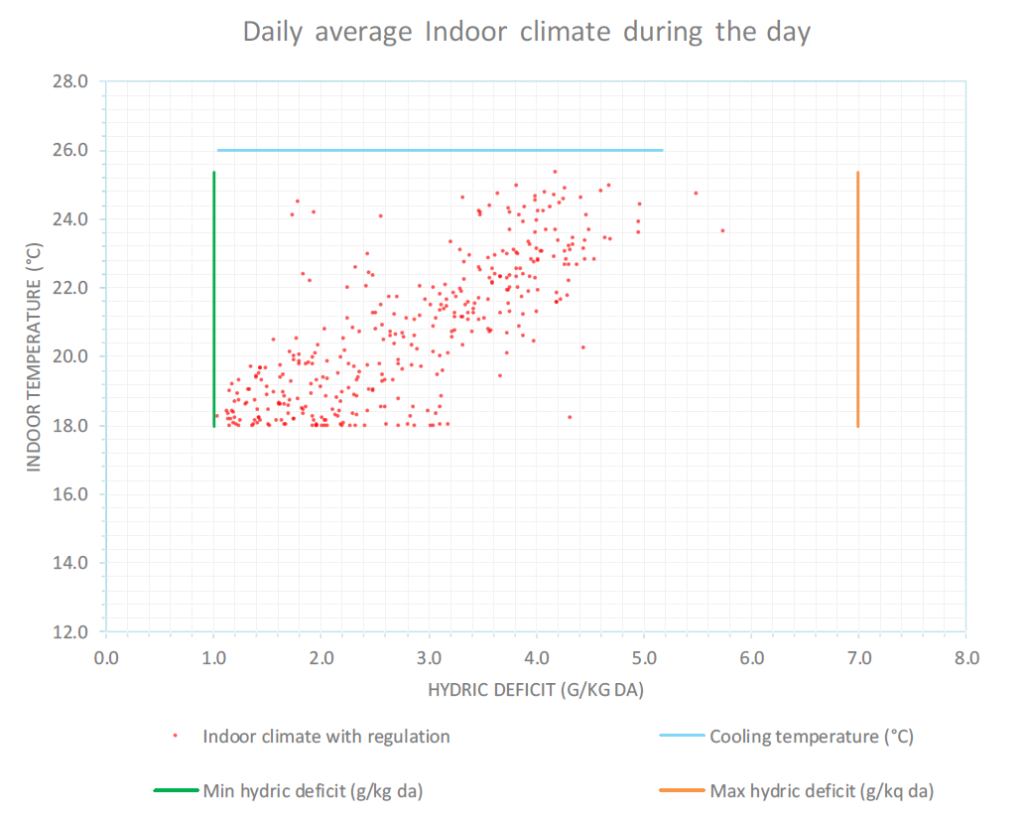
2. Correlation between indoor temperature and hydric deficit
Climate control greenhouse is analysed by several correlations between indoor temperature and hydric deficit:
- average temperature and hydric deficit during daytime
- indoor climate during daytime in January
- indoor climate during daytime in July
- daily lowest and highest temperature
The graph shows average temperature and hydric deficit during daytime for each day of period’s cultivation.
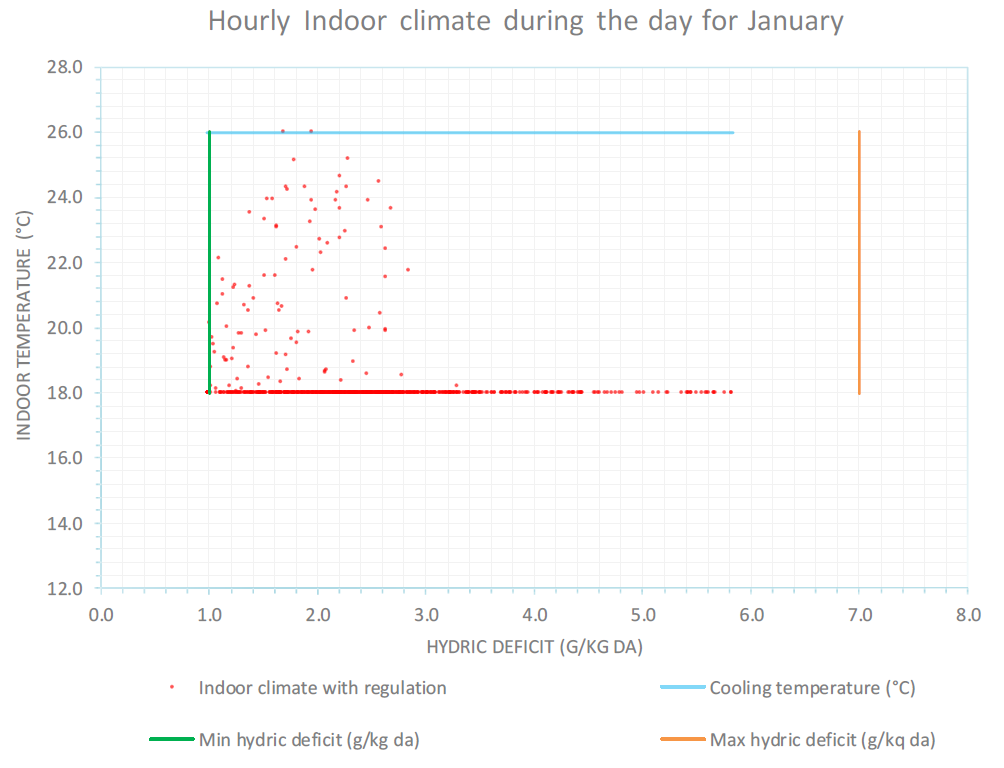
Indoor climate during daytime in January
The graph analyses hourly correlation between indoor temperature and hydric deficit during daytime in January. User can assess if hydric is not too low during morning and evening period.
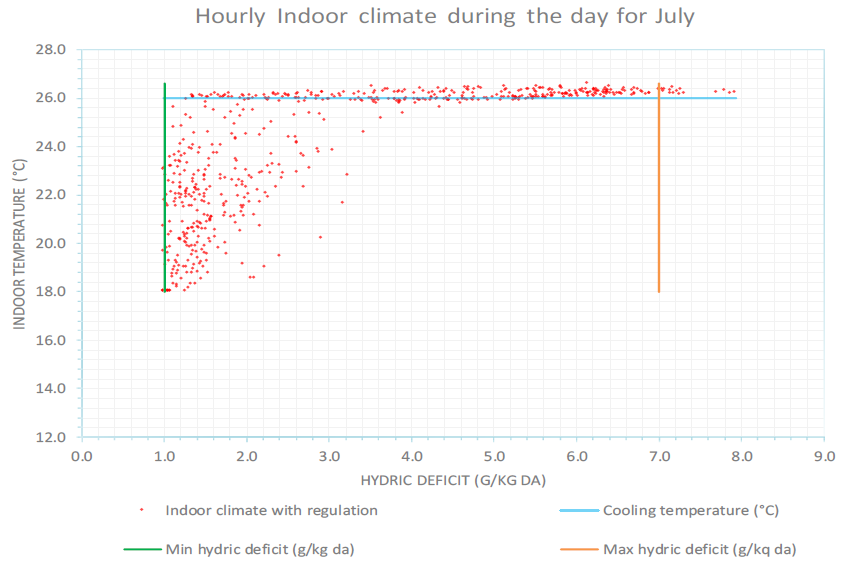
Indoor climate during daytime in July
The graph analyses hourly correlation between indoor temperature and hydric deficit during daytime in July. User can assess if hydric is not too low during morning or too high when temperature and solar radiation rise.
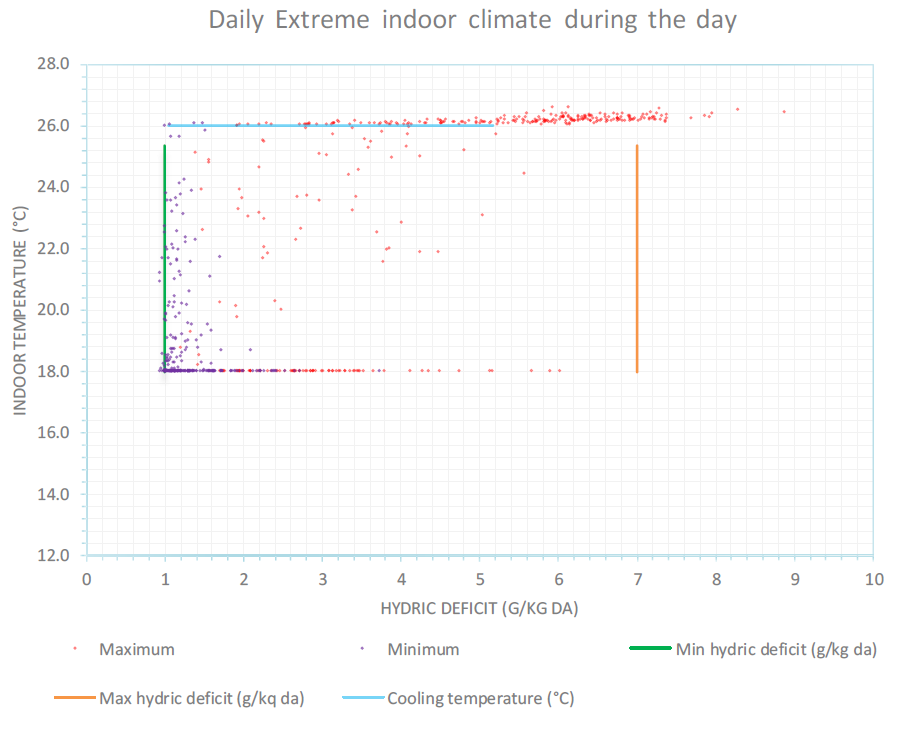
Daily lowest and highest temperature
The hydric deficit correlated with daily lowest and highest temperature is also useful to improve climate control.
User can optimise the climate control and reduce risks based on these analyses.
Hortinergy has been developed by Agrithermic in partnership with the CTIFL (French Interprofessional Technical Centre for Fruits and Vegetables) and Astredhor (Horticultural institute of technology), the Agrocampus Ouest and the agricultural high school of La Cote saint André (CFPPA).
With Hortinergy, you can simulate screens, semi-closed greenhouse, energy consumption, sustainability, cannabis greenhouse, supplemental lighting, and calculate carbon tax rebate. We also provide trainings on energy consumption to become a greenhouse designer.
Hortinergy is an online software. You can choose your offer, create an account and start your project.