Compare Greenhouse Solutions with Hortinergy’s Scenario Comparison Tool

NEW 2025 - scenario comparison tool makes comparisons easier and faster, and allows you to export datas with a single click

Our new version of our Scenario Comparison Tool, now enables you to compare different greenhouse configurations quickly, clearly and visually.

No need to create your comparison spreadsheets yourself! Hortinergy handles it all.

Export your results in the form of datas charts and graphs in one click, directly into Excel.

A real time-saver for your analyzes and presentations.

With this update, you can:

✅ Select the scenarios you want to compare
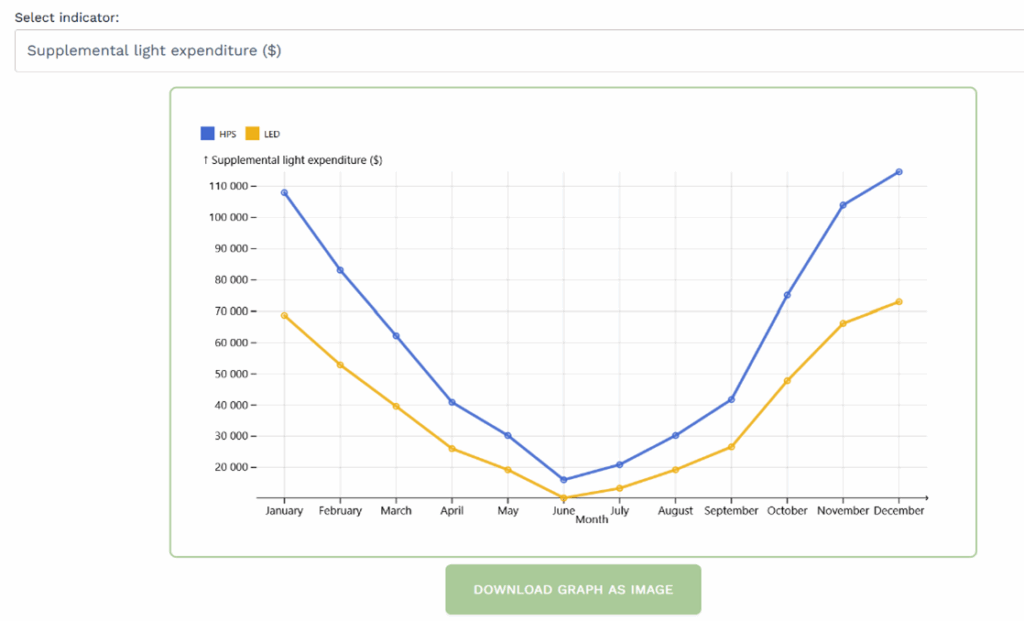
📈 Choose the key indicators for your analysis
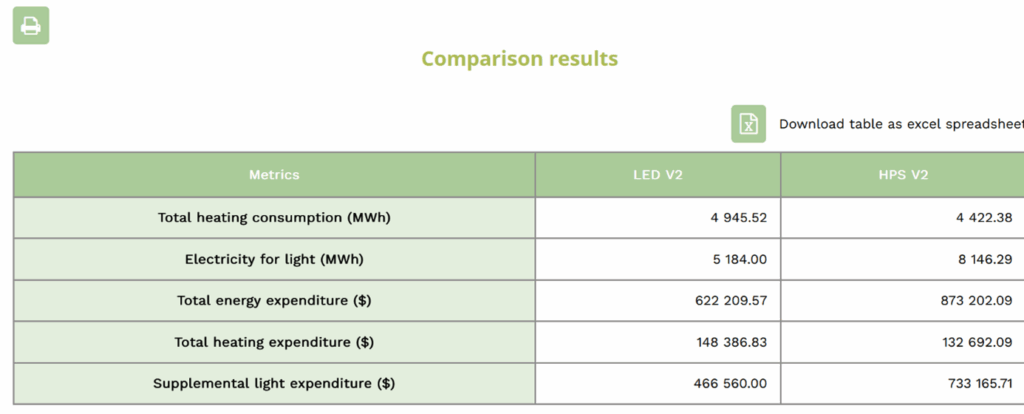
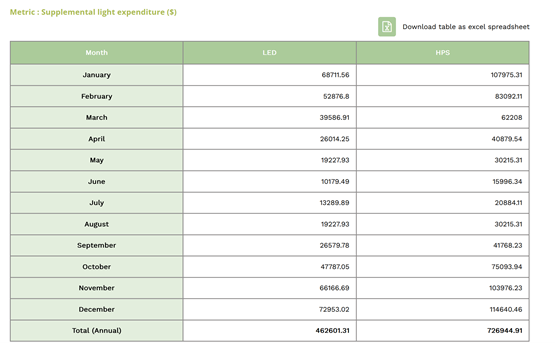
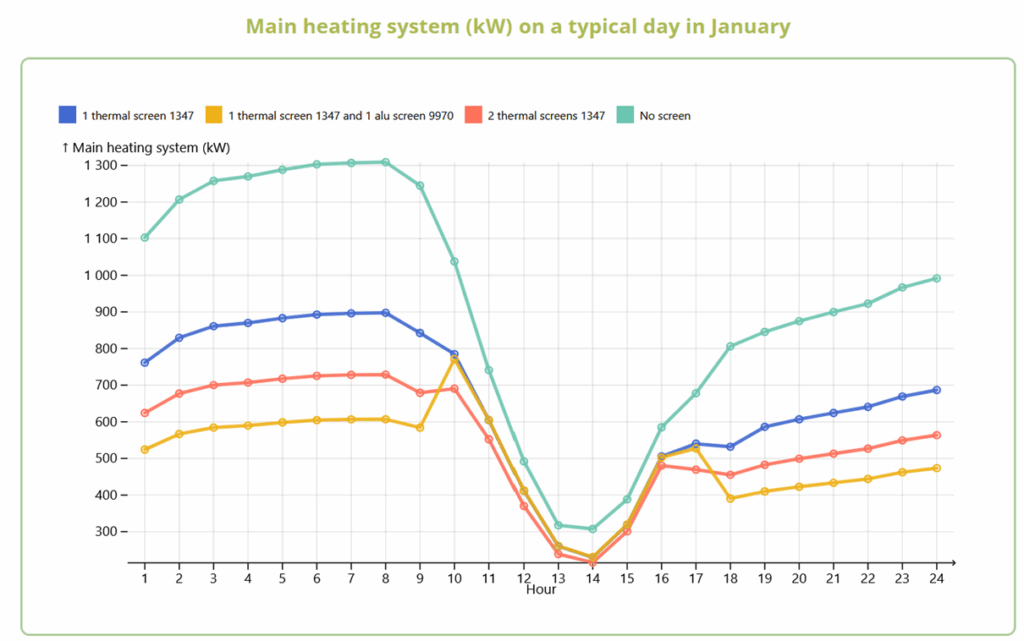
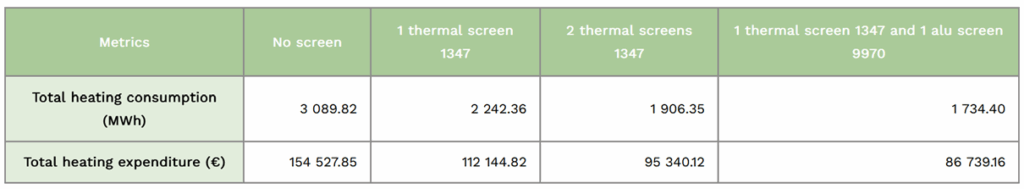
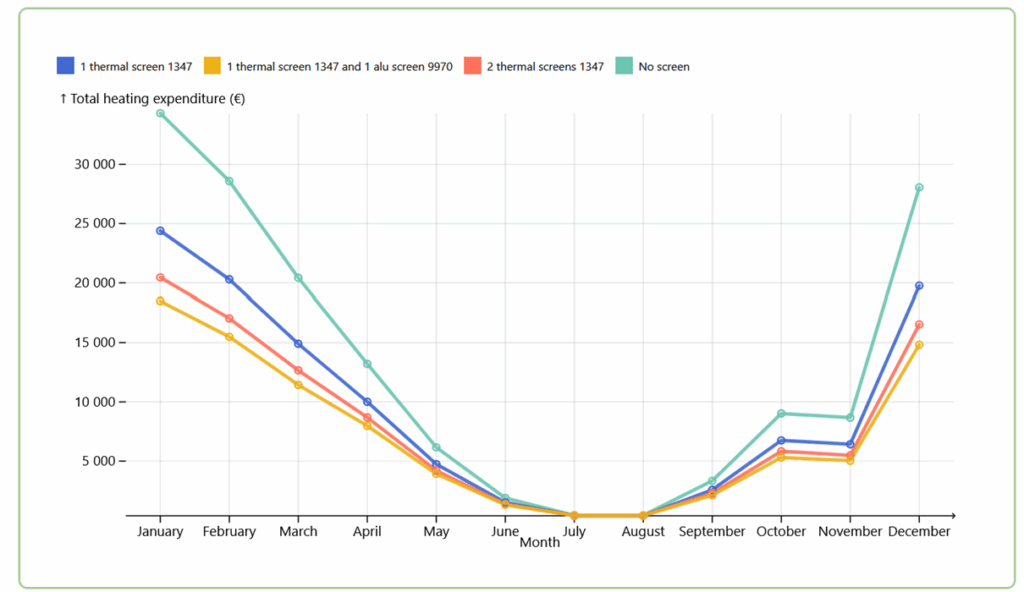
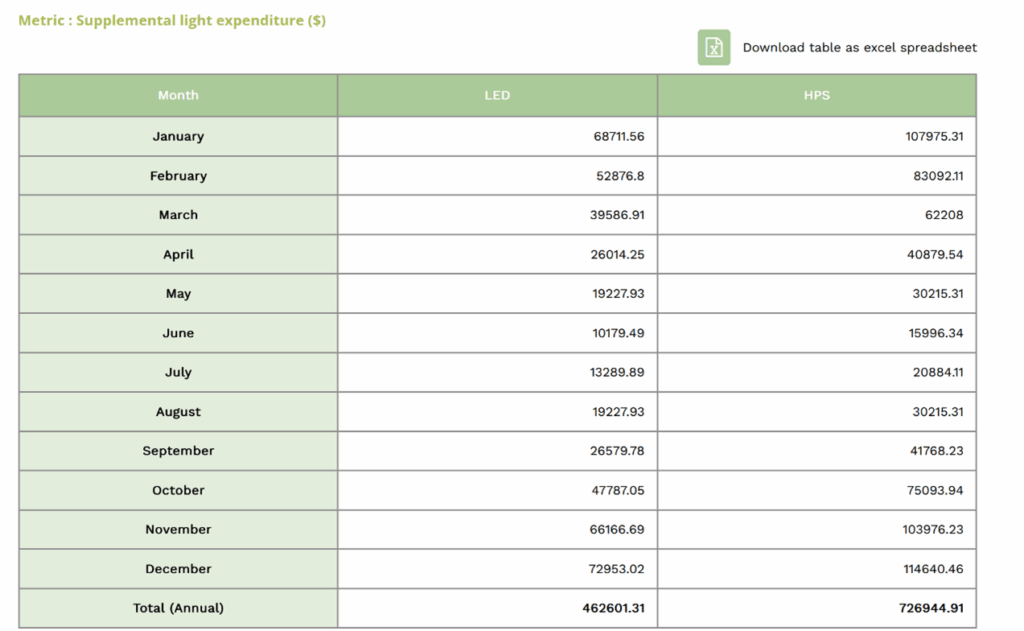
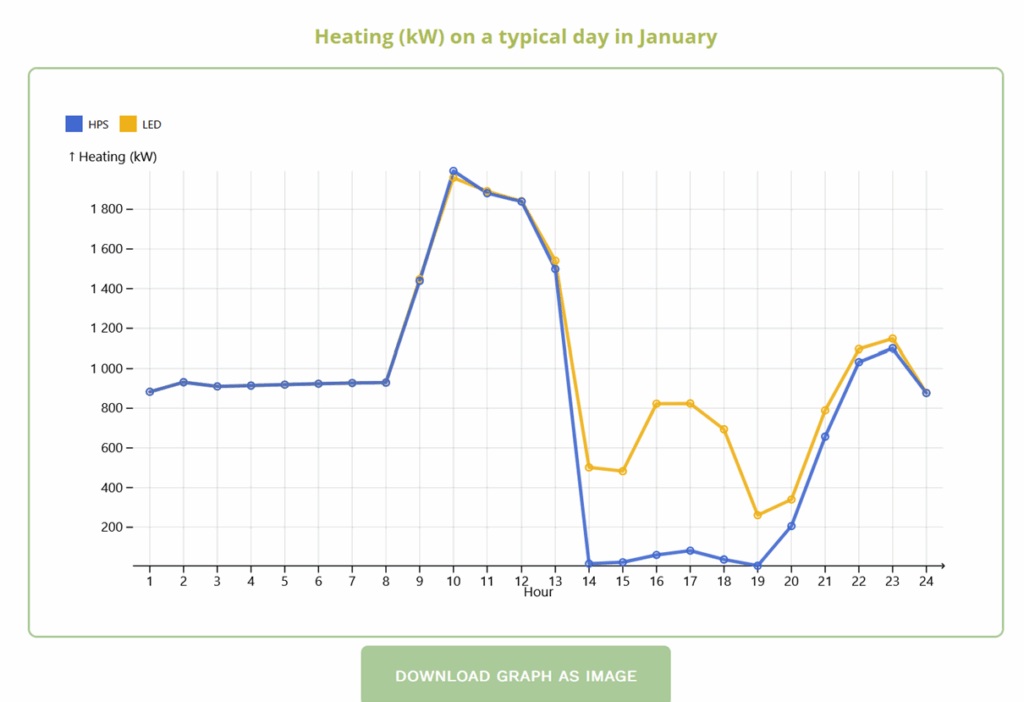
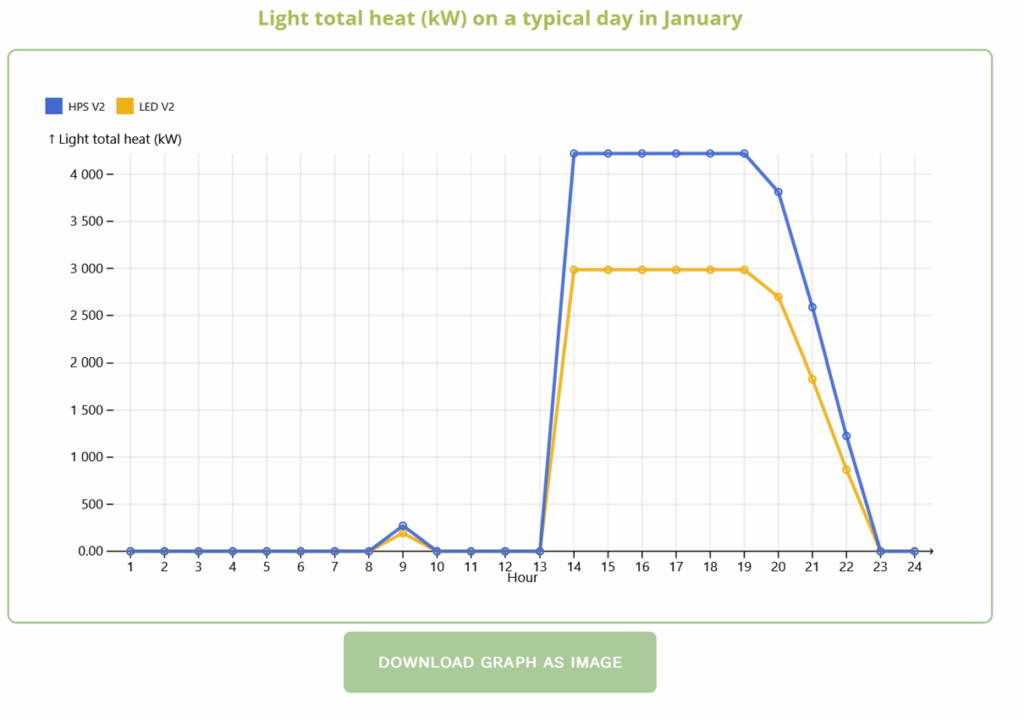
📅 Instantly generate a clear, structured comparison table and graph with annual, monthly or hourly data

📥 Export your results to Excel with just one click

  1. Annual report:

Compare the total impact of each configuration over a full year. Immediately observe differences in consumption, cost and efficiency with the scenario comparison tool

scenario comparison tool annual table hortinergy
  1. Monthly report:

Analyse the trends in your costs, consumption and assets on a month-by-month basis. Identify the most critical periods or consumption peaks with the scenario comparison tool.

scenario comparison tool thermal screen hortinergy
scenario comparison tool supplemental light hortinergy
  1. Hourly view of our Scenario Comparison Tool:

Get a detailed hour-by-hour simulation for each month.

Precisely compare the efficiency of your technical solutions.

See the immediate results of each configuration (cooling, humidity, energy…).

scenario comparison tool heating system

We propose 2 cases studies:

  • Comparison between several screen configuration in heating expenditures
  • Comparison between LED and HPS supplemental lighting

I) Case study : screens comparison in south of France with the scenario comparison tool

Regarding the comparison between several screens:

We study the impact of several screen configuration in heating expenditure for a 10 000 m² venlo greenhouse in south France.

We compare the following configurations:

  • No screen
  • 1 thermal screen 1347
  • 2 thermal screens 1347
  • 1 thermal screen 1347 and 1 aluminium screen 9970

Annual heating expenditure :

The results are very interesting and easily comparable online, thanks to the new version of Hortinergy with its scenario comparison tool. 

scenario comparison tool annual metrics

Monthly expenditure :

scenario comparison tool monthly expenditure

Hourly energy consumption :

scenario comparison tool heating system hortinergy

II) Case study : Supplemental lighting, comparison HPS vs LED in Lemington (Ontario/Canada) with the scenario comparison tool

We recently compared two types of lighting (HPS and LED) for a 10,000m² cannabis project in Lemington (Ontario, Canada).

– Consumption and heating costs

– Consumption and lighting costs

Annual comparison :

scenario comparison tool comparison tool

LED are more efficient than HPS in photosynthesis lighting. 

Electricity expenditures, the main costs, are reduced by 35%. HPS generate more heat.

The total monthly costs are reduced by 29 %.

scenario comparison tool monthly supplemental lighting

Hourly basis :

scenario comparison tool hourly graph
scenario comparison tool light hourly values hortinergy

With Hortinergy, you can simulate screens, semi-closed greenhouse, energy consumption, sustainability, cannabis greenhouse, supplemental lighting, and calculate carbon tax rebate. We also provide trainings on energy consumption to become a greenhouse designer.

Hortinergy is an online software. You can choose your offer, create an account and start your project.

Scroll to Top